
Lino Lakes
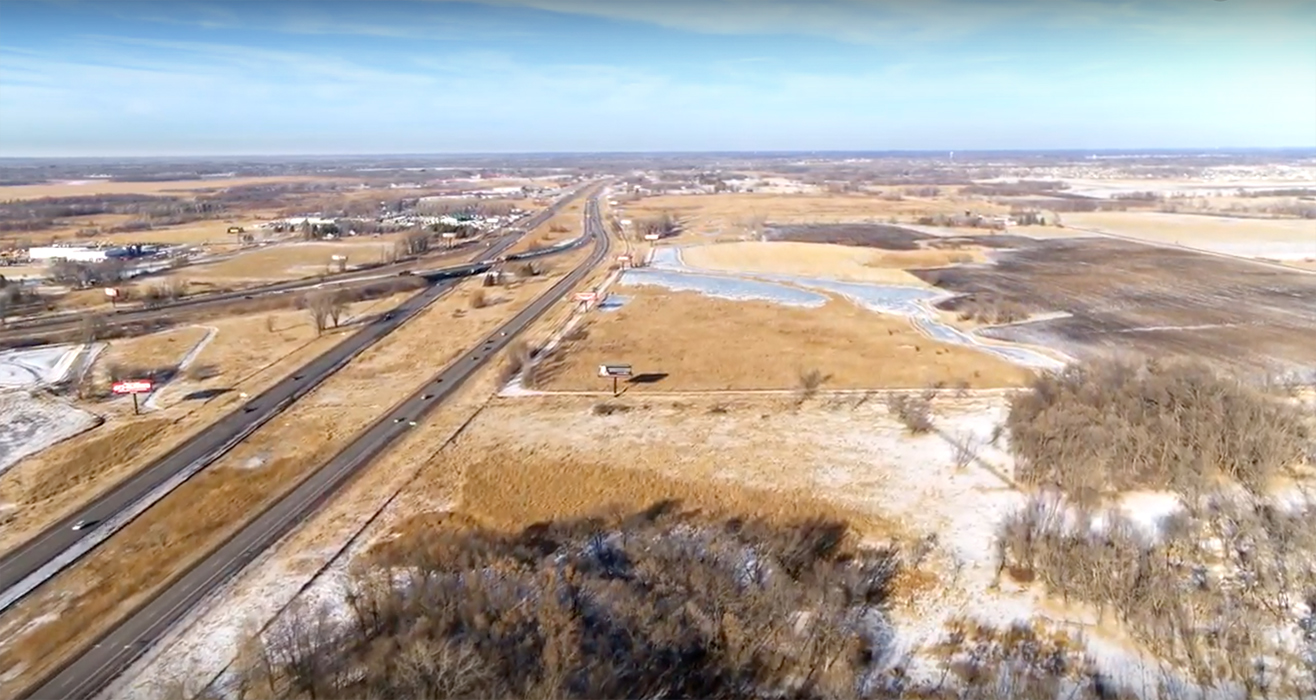
Lino Lakes is a city of just over 21,000 people in Anoka County, Minnesota. A community with just over 33 square miles, some of which has been untouched for development. With available land, access to I-35W & I-35E and strong area employers, Lino Lakes has become highly desirable in the Minneapolis/St. Paul metro to business and residential development.
Population
Back To Top
Back To Top
Population
| Population | 2000 | 2010 | 2023 | 2028 |
|---|---|---|---|---|
| Lino Lakes | 16,808 | 20,216 | 22,567 | 23,537 |
Source: ESRI, 2023-10-17
Population by Age
| Population | 2023 |
|---|---|
| 0-4 | 1,133 |
| 5-9 | 1,411 |
| 10-14 | 1,856 |
| 15-19 | 1,676 |
| 20-24 | 1,258 |
| 25-29 | 1,471 |
| 30-34 | 1,531 |
| 35-39 | 1,506 |
| 40-44 | 1,703 |
| 45-49 | 1,735 |
| 50-54 | 1,775 |
| 55-59 | 1,779 |
| 60-64 | 1,426 |
| 65-69 | 1,005 |
| 70-74 | 625 |
| 75-79 | 338 |
| 80-84 | 178 |
| 85+ | 161 |
| 18+ | 17,055 |
| Median Age | 38 |
Source: ESRI, 2023-10-17
Population by Race
| Lino Lakes | 2023 |
|---|---|
| Total | 22,567.00 |
| White Alone | 85.64% |
| Black Alone | 3.7% |
| American Indian Alone | 0.84% |
| Asian Alone | 3.81% |
| Pacific Islander Alone | 0% |
| Some Other Race | 0.86% |
| Two or More Races | 5.15% |
| Hispanic Origin | 2.76% |
| Diversity Index | 30.10 |
Source: ESRI, 2023-10-17
Growth Rate
| Lino Lakes | 2023 - 2028 |
|---|---|
| Population | 0.85% |
| Households | 0.92% |
| Families | 0.94% |
| Median Household Income | 3% |
| Per Capita Income | 3% |
Source: ESRI, 2023-10-17
Housing
Back To Top
Households
| Population | 2000 | 2010 | 2023 | 2028 |
|---|---|---|---|---|
| Households | 4,861 | 6,174 | 7,373 | 7,717 |
| Housing Units | 4,926 | 6,323 | 7,578 | 7,968 |
| Owner Occupied Units | 6,861 | 7,249 | ||
| Renter Occupied Units | 512 | 468 | ||
| Vacant Units | 205 | 251 |
Source: ESRI, 2023-10-17
Home Value
| Lino Lakes | 2023 | 2028 |
|---|---|---|
| Median Home Value | $383,615 | $403,546 |
| Average Home Value | $413,398 | $431,641 |
| <$50,000 | 83 | 4 |
| $50,000 - $99,999 | 2 | 0 |
| $100,000 - $149,999 | 2 | 0 |
| $150,000 - $199,999 | 41 | 0 |
| $200,000 - $249,999 | 200 | 57 |
| $250,000 - $299,999 | 823 | 453 |
| $300,000 - $399,999 | 2,725 | 3,026 |
| $400,000 - $499,999 | 1,767 | 2,355 |
| $500,000 - $749,999 | 1,085 | 1,258 |
| $1,000,000 + | 16 | 5 |
Source: ESRI, 2023-10-17
Housing Year Built
| Year Range | Houses Built |
|---|---|
| 2010 or Later | 423 |
| 2000-2009 | 1,417 |
| 1990-1999 | 2,115 |
| 1980-1989 | 1,230 |
| 1970-1979 | 1,083 |
| 1960-1969 | 530 |
| 1950-1959 | 228 |
| 1940-1949 | 182 |
| 1939 or Before | 129 |
Source: ESRI, 2023-10-17
Back To TopIncome
Back To Top
Income
| Lino Lakes | 2023 | 2028 |
|---|---|---|
| Median Household | $125,139 | $143,628 |
| Average Household | $162,077 | $183,093 |
| Per Capita | $53,089 | $60,159 |
Source: ESRI, 2023-10-17
Household Income
| Lino Lakes | 2023 |
|---|---|
| <$15,000 | 154 |
| $15,000 - $24,999 | 207 |
| $25,000 - $34,999 | 345 |
| $35,000 - $49,999 | 233 |
| $50,000 - $74,999 | 786 |
| $75,000 - $99,999 | 984 |
| $100,000 - $149,999 | 1,614 |
| $150,000 - $199,999 | 1,326 |
| $200,000+ | 1,722 |
Source: ESRI, 2023-10-17
Back To TopEmployees
Back To Top
Commute
| Category | Commuters |
|---|---|
| Workers 16+ | 11,055 |
| In-County Residents | 4,215 |
| Out-of-County Residents | 6,708 |
| Drive Alone | 8,758 |
| Carpooled | 365 |
| Public Transport | 249 |
| Work at Home | 1,536 |
| Motorcycle | 0 |
| Bicycle | 0 |
| Walked | 24 |
| Other | 123 |
| Less than 5 minutes | 170 |
| 5-9 minutes | 701 |
| 10-14 minutes | 1,023 |
| 15-19 minutes | 819 |
| 20-24 minutes | 1,740 |
| 25-29 minutes | 935 |
| 30-34 minutes | 2,052 |
| 35-39 minutes | 443 |
| 40-44 minutes | 538 |
| 45-59 minutes | 661 |
| 60-89 minutes | 265 |
| 90+ minutes | 172 |
| Average Travel Time | 0 |
Source: ESRI, 2023-10-17
Source: ESRI, 2023-10-17
Employees by NAICS
| Category | Number |
|---|---|
| Total Employees | 5,199 |
| Agr/Forestry/Fish/Hunt | 9 |
| Mining | 0 |
| Utilities | 0 |
| Construction | 439 |
| Manufacturing | 642 |
| Wholesale Trade | 258 |
| Retail Trade | 798 |
| Motor Veh/Parts Dealers | 44 |
| Furn & Home Furnish Str | 6 |
| Electronics & Appl Store | 0 |
| Bldg Matl/Garden Equip | 16 |
| Food & Beverage Stores | 89 |
| Health/Pers Care Stores | 17 |
| Gasoline Stations | 16 |
| Clothing/Accessory Store | 2 |
| Sports/Hobby/Book/Music | 182 |
| General Merchandise Str | 426 |
| Transportation/Warehouse | 488 |
| Information | 54 |
| Finance & Insurance | 285 |
| Cntrl Bank/Crdt Intrmdtn | 123 |
| Sec/Cmdty Cntrct/Oth Inv | 142 |
| Insur/Funds/Trusts/Other | 20 |
| Real Estate/Rent/Leasing | 50 |
| Prof/Scientific/Tech Srv | 219 |
| Legal Services | 3 |
| Mgmt of Comp/Enterprises | 2 |
| Admin/Support/Waste Mgmt | 43 |
| Educational Services | 293 |
| HealthCare/Social Assist | 570 |
| Arts/Entertainment/Rec | 94 |
| Accommodation/Food Srvcs | 385 |
| Accommodation | 59 |
| Food Srv/Drinking Places | 326 |
| Other Srv excl Pub Admin | 397 |
| Auto Repair/Maintenance | 61 |
| Public Administration Emp | 160 |
Source: ESRI, 2023-10-17
Educational Attainment (25+)
| Lino Lakes | 2023 |
|---|---|
| <9th Grade | 119 |
| Some High School | 174 |
| GED | 760 |
| Graduated High School | 2,592 |
| Some College/No Degree | 2,553 |
| Associates Degree | 2,038 |
| Bachelor's Degree | 4,790 |
| Graduate Degree | 2,207 |
Source: ESRI, 2023-10-17
Back To TopBusinesses
Back To Top
Businesses by NAICS
| Category | Number |
|---|---|
| Total Businesses | 367 |
| Agr/Forestry/Fish/Hunt Bus | 3 |
| Mining Bus | 0 |
| Utilities Bus | 0 |
| Construction Bus | 37 |
| Manufacturing Bus | 25 |
| Wholesale Trade Bus | 14 |
| Retail Trade Bus | 37 |
| Motor Veh/Parts Dealers Bus | 5 |
| Furn & Home Furnish Str Bus | 2 |
| Electronics & Appl Store Bus | 0 |
| Bldg Matl/Garden Equip Bus | 5 |
| Food & Beverage Stores Bus | 6 |
| Health/Pers Care Stores Bus | 3 |
| Gasoline Stations Bus | 2 |
| Clothing/Accessory Store Bus | 2 |
| Sports/Hobby/Book/Music Bus | 8 |
| General Merchandise Str Bus | 4 |
| Transportation/Warehouse Bus | 13 |
| Information Bus | 12 |
| Finance & Insurance Bus | 24 |
| Cntrl Bank/Crdt Intrmdtn Bus | 8 |
| Sec/Cmdty Cntrct/Oth Inv Bus | 8 |
| Insur/Funds/Trusts/Other Bus | 8 |
| Real Estate/Rent/Leasing Bus | 13 |
| Prof/Scientific/Tech Srv Bus | 36 |
| Legal Services Bus | 1 |
| Mgmt of Comp/Enterprises Bus | 1 |
| Admin/Support/Waste Mgmt Bus | 11 |
| Educational Services Bus | 10 |
| HealthCare/Social Assist Bus | 33 |
| Arts/Entertainment/Rec Bus | 10 |
| Accommodation/Food Srvcs Bus | 21 |
| Accommodation Bus | 2 |
| Food Srv/Drinking Places Bus | 19 |
| Other Srv excl Pub Admin Bus | 40 |
| Auto Repair/Maintenance Bus | 12 |
| Public Administration Bus | 6 |
Source: ESRI, 2023-10-17
Back To Top